

The first mistake in analyzing a war is to turn it into a ticker symbol.
Oil goes up. Gold goes up. Stocks go down. Bitcoin, depending on the speaker, either becomes digital gold or collapses with everything else. These reactions are plausible for a day. They are not an investment thesis for a year.
The U.S.-Iran war is now more than four months old. It began with American and Israeli strikes on February 28, effectively closed the Strait of Hormuz, and caused the largest oil-market disruption in decades. A June agreement and subsequent preliminary deal did not hold. By July 19, 2026, attacks on commercial shipping and military targets had resumed; the Associated Press reported that the agreement had collapsed, even as mediators continued trying to salvage it.
That chronology matters. The market is no longer pricing only the probability of war. It is pricing depleted inventories, damaged infrastructure, expensive insurance, improvised shipping routes, political fatigue, and the chance that a future ceasefire will fail like the last one.
The central question is not whether the conflict creates a “war premium.” It is which premium, in which asset, over which horizon.
The strait is a physical fact, not a metaphor
Before the war, the Strait of Hormuz was the narrow exit for an extraordinary share of the world’s energy. The U.S. Energy Information Administration estimated that 20.9 million barrels a day of oil moved through the strait in the first half of 2025. That was about 20 percent of global petroleum-liquids consumption and one-quarter of seaborne oil trade. More than 20 percent of global liquefied-natural-gas trade used the same route.
There are bypasses, but not an alternative system. Saudi Arabia’s east-west pipeline and the United Arab Emirates’ line to Fujairah could together move roughly 4.7 million barrels a day outside the strait. That is useful capacity; it is nowhere near enough to replace normal Hormuz traffic.
The world absorbed the first months better than feared. Prewar supply had been running above demand. Producers outside the Gulf increased output. Consumers, especially in Asia, cut use or switched fuels. Governments released or drew down reserves. By mid-July, the IMF estimated that crude had settled mostly in a $90-to-$100 range despite a missing 1.1 billion barrels by the end of May.
That resilience should not be confused with abundance. It was purchased with inventory, spare capacity, lower consumption, and fiscal support. Those buffers are finite. Even if the strait reopened tomorrow, tankers would not instantly return, insurers would not instantly normalize coverage, and shut-in wells would not all restart on command. Industry estimates cited by the IMF suggest that a meaningful recovery in flows could take two to three months after a full reopening.
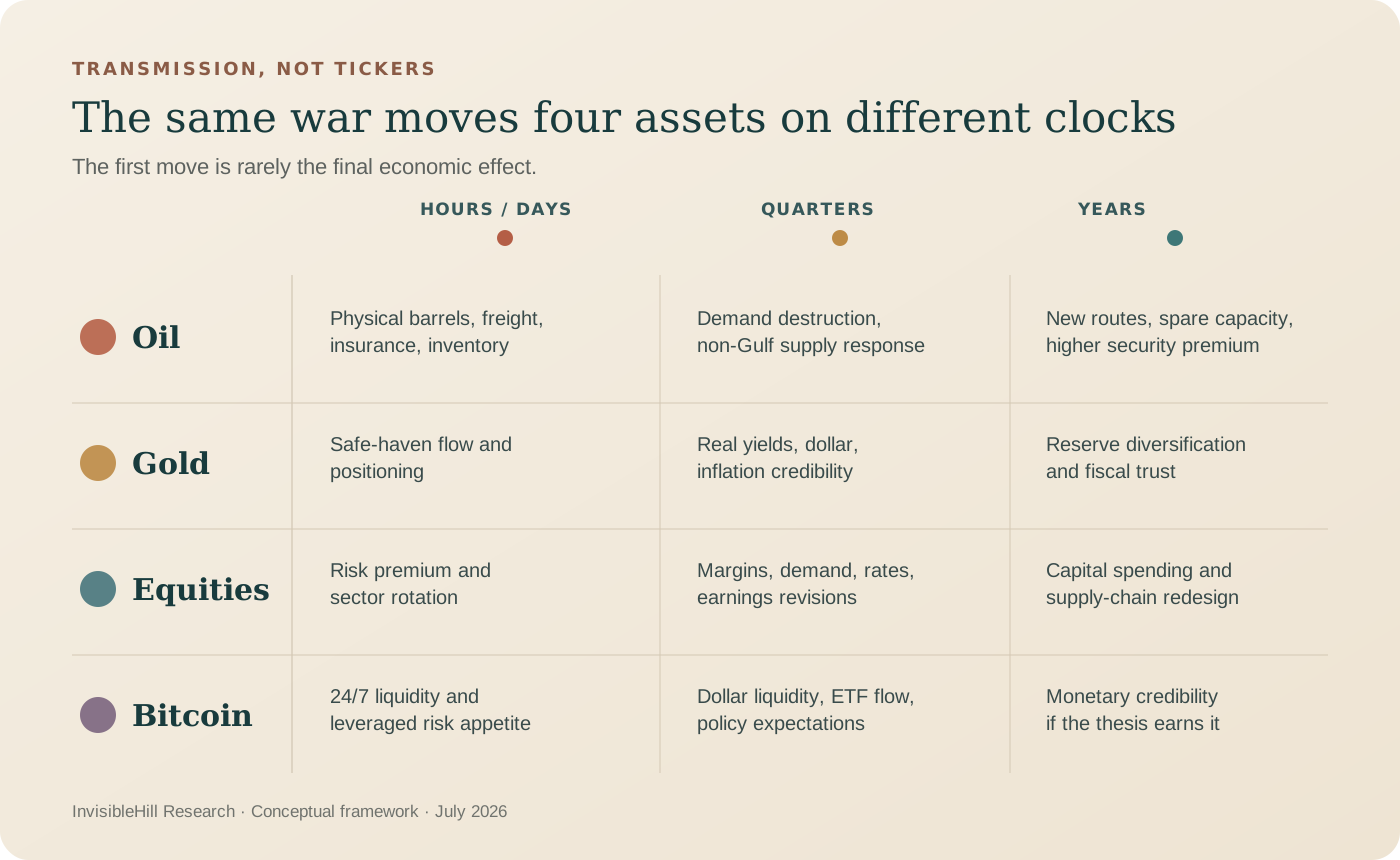
Oil: the upside is nonlinear, the recovery is slow
Oil is the asset most directly tied to the war, but even here the relationship is not one-for-one.
In the short run, prices respond to physical availability: cargoes loaded, ships insured, pipelines operating, inventories accessible. A tanker attack can move prices even when no terminal is damaged because freight rates and war-risk premiums become part of the delivered cost. A credible reopening can lower prices before the first delayed cargo arrives because markets trade expected balances.
Over several quarters, the adjustment moves into the real economy. High prices destroy demand, encourage production outside the Gulf, and make alternative routes economical. They also suppress activity in importing countries. The IMF’s July update found that the world economy had held up better than expected, but global headline inflation was revised to 4.7 percent for 2026 and the disinflation trend had stalled. Europe and import-dependent parts of Asia carried a larger burden than the energy-producing United States.
This produces an asymmetric medium-term outlook. A durable agreement would remove the acute scarcity premium, but prices might not return immediately to the prewar world. Commercial inventories need rebuilding. Infrastructure needs inspection and repair. Shippers will charge for a route that has demonstrated it can close. Producers will want compensation before committing capital to new capacity.
The adverse case is more dangerous because the response is nonlinear. Another interruption now begins with thinner buffers than the first. Damage to export terminals, pipelines, refineries, or power systems could matter more than a headline about naval control of the strait. Refined products are especially vulnerable: Gulf capacity is unusually important to global diesel and jet-fuel supply, and a crude barrel in storage is not a gallon of diesel in the right port.
The long-term effect is likely to be less dependence on the chokepoint, not no dependence. Iraq is already pursuing alternative routes through Syria. Asian buyers will value larger strategic inventories. Gulf producers will invest in pipelines and ports outside the strait. Importing countries will accelerate efficiency, electrification, and renewable power for reasons that are as much about national security as climate. These responses eventually cap oil’s upside. They also require years and large amounts of capital.
Gold: a hedge against the policy response, not only the shooting
Gold’s first move in a crisis is usually described as safe-haven buying. Its lasting move depends on what the crisis does to real interest rates, the dollar, inflation expectations, fiscal credibility, and central-bank reserves.
That distinction explains why gold can fall on a frightening day. Investors may sell liquid winners to meet margin calls. A stronger dollar can weigh on the metal. If central banks respond to an oil shock with higher real rates, the opportunity cost of holding a non-yielding asset rises. The geopolitical story can be bullish while the monetary reaction is temporarily bearish.
The structural backdrop is more supportive than the daily story suggests. Central banks bought more than 1,000 metric tons of gold in each of the three years through 2024, roughly twice the average pace of the preceding decade. In the first quarter of 2026, official institutions added an estimated 244 tons, above both the previous quarter and the five-year average. That demand is partly a judgment about reserve diversification and sanctions risk, not a trade on the next ceasefire headline.
The war strengthened retail demand as well, though unevenly. World Gold Council data show first-quarter bar-and-coin investment up 42 percent from a year earlier, while Western exchange-traded-fund flows weakened in March. That is a useful warning against treating “gold demand” as one buyer with one motive.
In a negotiated settlement, gold could surrender some immediate fear premium. Over the medium and long term, however, the more important questions are whether the conflict leaves governments with larger deficits, whether energy inflation forces tighter policy, and whether reserve managers become more determined to hold assets without another country’s credit risk. Peace can be bearish for fear and still leave the monetary case intact.
Equities: the index hides the war
War rarely gives the stock market a single earnings forecast. It redistributes income between sectors and countries while changing the discount rate applied to all of them.
Energy producers benefit from higher realized prices, but the strongest oil price is not necessarily the best outcome for an integrated major. Assets can be stranded behind the strait, facilities damaged, costs inflated, and host governments tempted to change taxes. Oil-field-services firms may gain later, when producers commit to drilling and infrastructure rather than merely enjoy a windfall.
Airlines, shipping-dependent manufacturers, chemicals, logistics, agriculture, and discretionary consumer businesses face the other side of the transfer. Their fuel and feedstock costs rise while households have less money left to spend. Banks in energy-importing emerging markets may confront weaker currencies, higher rates, and deteriorating borrowers at the same time.
The broad index is then pulled by two macro variables: expected earnings and the interest rate used to value them. If energy inflation stays mostly in headline prices, profit margins and growth can absorb the shock. If it changes wages, inflation expectations, and central-bank policy, the valuation effect spreads far beyond fuel-sensitive companies. The Federal Reserve’s May financial-stability survey identified geopolitical risk and an oil shock as the most-cited near-term threats, precisely because a stagflationary shock can force tighter policy while growth is weakening.
Geography matters. The United States is now a major energy producer and net exporter, so some national income lost at the gas pump returns through domestic producers, workers, and investment. Europe and much of Asia are more exposed to the import bill. Gulf equity markets face a different paradox: high global oil prices can coincide with weak domestic activity when exports, ports, tourism, and infrastructure are disrupted.
The medium-term winners are therefore not simply “defense and oil.” They are companies with secure supply, pricing power, modest leverage, and the ability to invest while competitors are constrained. The long-term legacy will appear in capital budgets: redundant suppliers, strategic inventories, shorter logistics chains, pipeline capacity, grid investment, and defense. Much of that spending is economically inefficient in a peaceful world. Resilience is the return it buys.
Bitcoin: liquid first, monetary later
Bitcoin trades every hour of every day. That makes it one of the first large assets investors can sell when risk changes over a weekend. Accessibility is not the same thing as safety.
In the opening phase of a crisis, Bitcoin is usually governed by dollar liquidity, leverage, exchange-traded-fund flows, and appetite for volatile assets. Derivatives are liquidated automatically. Investors who need collateral sell what is open. A decentralized settlement network may continue operating exactly as designed while the token price falls like a high-beta risk asset.
The empirical case for “digital gold” remains weak at this horizon. CME research found that Bitcoin’s rolling relationship with gold had never become particularly strong and that the correlation had fallen back toward zero since 2024. That does not make Bitcoin worthless as a monetary asset. It means the hedge is not reliable on the day it is most tempting to assume one.
The medium-term case is conditional. A prolonged war could increase fiscal deficits, capital controls, cross-border payment frictions, and distrust of state liabilities. These are all arguments Bitcoin was built to answer. The same war can also produce a stronger dollar, higher real rates, tighter liquidity, and risk-off selling. All are historically difficult conditions for Bitcoin. The asset does not respond to “geopolitical risk” in the abstract. It responds to the financial regime that follows.
Mining costs are a secondary channel. Expensive energy can pressure marginal miners, but global hash power can migrate, and the network’s difficulty adjusts. The larger price risk comes through liquidity and positioning, not the electric bill of a miner near the Gulf.
In the long run, Bitcoin’s strongest war-related case would come not from combat itself but from a durable loss of confidence in monetary and fiscal institutions. That thesis may ultimately prove right. It should not be confused with a promise that Bitcoin will rise during every missile alert.
Four scenarios that matter
The cleanest way to think about the next 12 to 36 months is through conditions, not targets.
-
A durable settlement and verified reopening. Oil loses scarcity premium, but only gradually as shipping, production, and inventories normalize. Gold may consolidate as immediate fear recedes. Equities receive both an earnings and rate-relief tailwind, led by import-sensitive markets. Bitcoin likely participates as liquidity and risk appetite improve.
-
An unstable corridor with intermittent attacks. Oil remains volatile and insurance stays expensive even when cargoes move. Gold retains strategic support but can be pulled in opposite directions by the dollar and real rates. Equity indexes may look resilient while airlines, industrials, and import-dependent countries absorb the damage. Bitcoin remains a risk asset around each escalation.
-
Renewed closure or major infrastructure damage. Oil’s upside becomes nonlinear because inventories and spare capacity are already depleted. Gold likely benefits, though not necessarily in a straight line. Broad equities face a stagflationary earnings and valuation shock. Bitcoin is more likely to sell off initially in a global dash for liquidity; its monetary narrative would be tested later.
-
A long conflict with adaptation. Demand destruction and new supply eventually restrain oil, even while the affected region remains impaired. Gold’s path shifts from fear to fiscal and reserve policy. Equity leadership moves toward energy security, infrastructure, and resilient supply chains. Bitcoin depends on whether the adaptation produces tight money and a strong dollar or visible erosion in trust.
None of these scenarios supports a permanent one-way trade. The price that first reflects scarcity eventually creates conservation and supply. The safe haven that first reflects fear eventually meets interest rates and positioning. The stock index that first reflects panic eventually differentiates cash flows. The crypto asset that first reflects liquidity may or may not earn a monetary premium later.
What the market is actually waiting for
Markets do not need a ceremony called peace. They need evidence that energy can move safely, repeatedly, and at an insurable cost.
The useful indicators are therefore concrete: daily tanker transits; loadings at Gulf terminals; war-risk insurance; diesel and jet-fuel cracks; commercial and strategic inventories; the restart rate of shut-in production; inflation expectations; and the language of central banks. Diplomatic headlines matter to the extent that they change those variables.
The conflict has already demonstrated something uncomfortable. The global economy is more adaptable than a map of oil flows implies, but the adaptation uses up buffers. The next shock does not begin from February’s balance sheet.
That is the real war premium: not fear alone, but the price of operating a global system with less room for error.
Sources
This article separates immediate market reaction from medium-term economic transmission and long-term capital allocation. It presents scenarios rather than point-price forecasts and is not individualized investment advice. Facts and market context are current through July 19, 2026.
- U.S. Energy Information Administration, World Oil Transit Chokepoints
- International Monetary Fund, The Oil Market Absorbed the War Shock, but Buffers Are Running Low
- Board of Governors of the Federal Reserve System, May 2026 Financial Stability Report
- World Gold Council, Q1 2026 Gold Demand Trends
- CME Group, Can Crypto World Break Free From Bitcoin’s Undertow?
- United Nations, July 2026 briefings on renewed Gulf confrontations