
Institutional flows changed the cycle
Bitcoin reached a record above $126,000 in October 2025, about 18 months after the April 2024 halving. By August 8, 2026, its daily close was near $64,963, roughly 48% below that peak. The calendar looks familiar: a halving, a new high the following year, then a large drawdown.
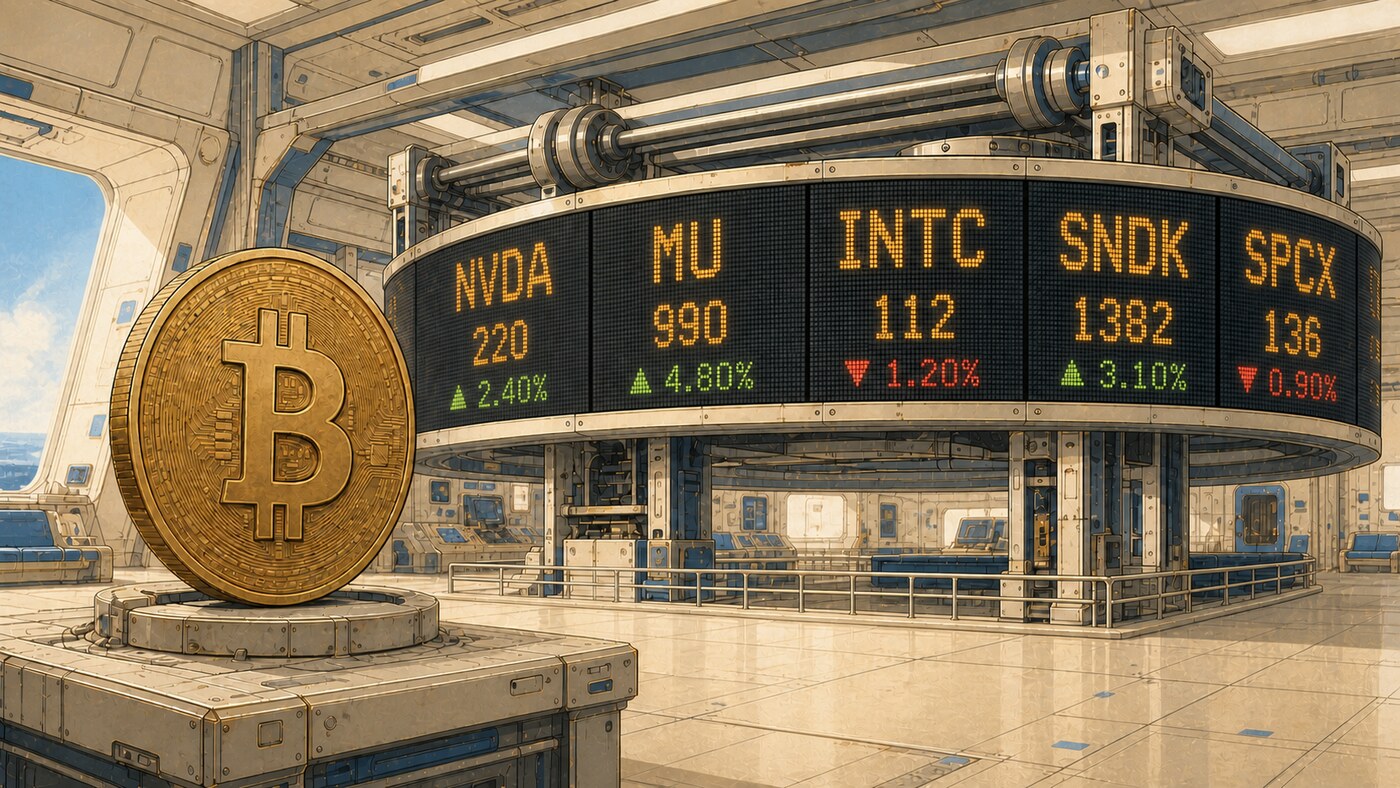
The route was different. Bitcoin first broke its 2021 record before the 2024 halving, helped by U.S. spot exchange-traded products. ETF and corporate treasury demand later absorbed far more Bitcoin than miners created. When those flows weakened, the same regulated channel transmitted redemptions back into the spot market. AI stocks offered a profitable, liquid alternative, while crypto exchanges began letting stablecoin holders buy tokenized U.S. equities without returning to a bank or broker.
The four-year cycle therefore still exists, but it no longer explains the market on its own. The halving remains a supply event and a coordination point for investor behavior. Marginal demand now comes through vehicles that can move faster than miner supply, in both directions. That makes a permanent supercycle less likely than a different kind of cycle: more institutional, more correlated with equities, and less generous to altcoins.
The four-year pattern survived its first ETF cycle
Bitcoin has only three completed post-halving price cycles before the current one. That is too small a sample to treat the pattern as a statistical law. It is still difficult to dismiss the sequence.
The protocol halves the block subsidy every 210,000 blocks, or approximately every four years. Previous market peaks arrived in 2013, 2017, and 2021. The 2024 halving cut the subsidy to 3.125 BTC, and the market reached its latest record in October 2025. The subsequent decline has been smaller than the 75% to 80% collapses associated with older cycles, but a drawdown near 50% is not what strict supercycle forecasts promised.
This does not prove that halvings caused each peak. The timing also reflects a market convention. Miners, funds, media, and retail traders know the schedule, so capital moves before the event in anticipation of other buyers. The cycle combines programmed supply with a shared clock.
The latest cycle preserved that clock while breaking one of its familiar details. Bitcoin crossed its prior record in March 2024, before the halving. Demand did not wait for the supply cut. That was the first clear sign that ETF access could pull a later-cycle move forward.
The halving matters less to price formation
At 3.125 BTC per block and roughly 144 blocks per day, miners now create about 450 BTC daily, or 3,150 BTC weekly. At a Bitcoin price near $65,000, that is approximately $29 million of new supply per day. The number is meaningful to miners. It is small beside modern capital flows.
NYDIG estimates that spot ETFs and corporate treasuries absorbed more than 10,000 BTC per week during much of Bitcoin's 2025 advance, with one week above 48,000 BTC. Several ETF inflow periods alone reached 15,000 to 30,000 BTC per week, several times weekly issuance.
A halving still reduces the recurring sell pressure needed to fund mining operations. It also reinforces the scarcity narrative when demand is already rising. It cannot create that demand, and each absolute reduction becomes smaller relative to the outstanding stock. ETF investors, corporate buyers, and long-term holders now absorb or release thousands of coins each week. The halving sets the background; flows increasingly set the pace.
ETFs became a two-way valve
The U.S. Securities and Exchange Commission approved the first group of spot Bitcoin ETPs in January 2024. That gave brokerage accounts, advisers, retirement portfolios, and institutional allocators a familiar route to Bitcoin exposure without direct custody.
The supercycle argument treated this access as a permanent bid. In 2025, it sometimes behaved that way. Bitcoin's climb above $126,000 coincided with the strongest period of ETF creations and corporate treasury purchases.
An ETF is not locked capital. It is designed to create and redeem shares as demand changes. NYDIG found that ETF activity became much less consistent in late 2025 and 2026, with several weeks of net redemptions approaching 15,000 to 25,000 BTC. Bitcoin fell from about $126,000 toward $60,000 as ETF and treasury demand deteriorated.
Regulated access made the market deeper, but it also connected Bitcoin more tightly to portfolio rebalancing, risk limits, tax decisions, and macro shocks. Part of the old exchange-driven cycle is now a faster institutional flow cycle.
AI stocks competed for the same risk budget
The AI equity boom gave investors another liquid way to express a high-growth, high-duration view. The Nasdaq-100 returned 21% in 2025. Technology averaged 61% of the index and produced 88% of its total return. The ten largest securities made up 52% of the index and returned an average of 35%.
Many leaders also had revenue, earnings, buybacks, and large balance sheets. They compete with Bitcoin and altcoins for the same marginal risk budget even though the assets are fundamentally different. Both respond to liquidity, discount rates, momentum, and willingness to accept duration risk.
CME research found that Bitcoin's correlation with the Nasdaq-100 moved from almost zero before 2020 to a generally positive range afterward. In 2025 and early 2026, correlations across crypto assets and the Nasdaq-100 often reached 0.35 to 0.60. Crypto tended to rise with U.S. technology stocks, but by less, then fall more when those stocks sold off.
AI enthusiasm can support Bitcoin by keeping risk appetite high, then absorb capital that might once have moved into crypto. The competition is harsher for altcoins. They usually lack Bitcoin's ETF access, monetary narrative, and depth while also lacking the cash flows of public companies.
Tokenized stocks changed what stablecoin liquidity means
Stablecoin balances on crypto exchanges were once treated as probable crypto buying power. A trader holding USDT or USDC could wait, earn yield, withdraw, or rotate into Bitcoin and altcoins. That inference is now weaker.
Binance offers bStocks inside its spot market. Its official conversion and withdrawal FAQ describes purchases using supported crypto, including USDT and USDC, conversion of eligible stock holdings into tokens, and direct bStock trading. It also describes 24/7 spot trading and withdrawals to compatible BNB Smart Chain wallets. Eligibility and transfer restrictions apply, and holding a bStock does not mean directly owning shares in the underlying company. The relevant change for crypto demand is that eligible users can choose equity exposure in the same venue.
Bitget's June 2, 2026 Stocks 2.0 announcement describes USDT trading and integration of eligible stock tokens with unified accounts, margin, trading strategies, and selected yield products. The same release says cumulative tokenized-stock spot volume had exceeded $1 billion by January 2026 and that Bitget handled about 89% of Ondo-issued tokenized-stock trading volume in December 2025. The percentage refers to that issuer's tokens, not all tokenized equities. These are company-reported figures; they establish activity on the platform but do not measure capital diverted from crypto.
An eligible trader can move from USDT into exposure to an AI stock or equity index inside the same interface and, in some products, outside U.S. market hours. The stablecoin never leaves the platform, yet the capital no longer bids for a crypto asset. Trading attention and market-maker inventory can move with it.
Exchanges do not disclose how much tokenized-stock volume would otherwise have entered crypto, so the aggregate diversion cannot yet be measured. The effect can still be severe at the margin, especially in thinner altcoin markets. When the next buyer has dozens of profitable U.S. companies one click away, stablecoin growth no longer implies an approaching altseason.
Altseason is becoming narrower
Earlier cycles had a familiar rotation. Bitcoin rose first, profits moved into Ether and large-cap tokens, then smaller assets rallied as traders reached for more beta. The pattern depended on a relatively closed crypto venue where most speculative choices were crypto assets.
An investor who buys Bitcoin through a brokerage account does not automatically enter a crypto exchange, open an on-chain wallet, or gain a mandate to buy altcoins. Stablecoin liquidity already inside an exchange can now leave the crypto risk stack without leaving the account.
The relative performance supports this interpretation. CME's early-2026 comparison found that only Bitcoin, XRP, and Stellar were above their early-2024 levels in its sample, while Ether and Chainlink had fallen as much as 40% to 50%. The exact ranking will change, but the broad lesson is durable. Bitcoin can receive institutional demand without creating a broad altcoin bid.
Future altcoin rallies are more likely to concentrate in networks with real usage, credible economics, regulatory access, or their own investment wrappers. Memecoins can still surge. A market in which every large Bitcoin move lifts almost everything for months is becoming harder to finance.
A supercycle needs more than permanent access
There are two meanings of supercycle, and they lead to different answers.
The strict version predicts that structural adoption will eliminate the familiar boom, peak, and deep drawdown. The 2025 peak and 2026 decline argue against it. ETF demand reversed, treasury buying lost breadth, and Bitcoin fell by almost half even in a relatively supportive U.S. policy environment.
The weaker version predicts a secular rise interrupted by shallower cycles. That remains plausible. Fidelity Digital Assets observed unusually low realized volatility soon after the October 2025 record and argued that Bitcoin's larger market capitalization and deeper liquidity could reduce the old pattern of blow-off tops and 80% crashes. Fidelity's maturation thesis and NYDIG's cyclical thesis can both fit a cycle whose amplitude is falling.
A true supercycle would require demand that keeps expanding through equity corrections, tighter financial conditions, ETF redemptions, and competition from other assets. Bitcoin has not passed that test. The more defensible base case is a long-term adoption trend expressed through recurring liquidity cycles, not one uninterrupted cycle.
How to read the next cycle
The next halving remains relevant, but it should sit beside flow, valuation, and cross-asset measures rather than above them.
ETF creations and redemptions show whether regulated capital is adding or removing marginal demand. Bitcoin's relationship with the Nasdaq-100 shows whether the market is trading it as an independent monetary asset or as high-beta technology exposure. Stablecoin use now needs to be separated by destination: crypto spot, lending, payments, tokenized Treasuries, and tokenized equities do not create the same demand for Bitcoin or altcoins.
Long-cycle valuation tools still help with context. BigRoom is developed by InvisibleHill, as disclosed in our site disclaimers. Its AHR999 Indicator compares Bitcoin's daily close with its 200-day cost line and a fitted long-term growth valuation. On August 9, 2026, the indicator read approximately 0.355, inside BigRoom's bottom zone, while Bitcoin traded below its 200-day average.
That reading describes valuation temperature within Bitcoin's own history. It does not measure ETF redemptions, AI equity opportunity cost, or tokenized-stock adoption. A low AHR999 reading can support a long-horizon accumulation case without proving that the cyclical low is complete. It is more useful beside flow and cross-asset evidence than as a calendar.
Bitcoin's supply anchor remains, and the latest peak and drawdown still fit the broad sequence. What changed is the source and destination of marginal capital. ETFs can pull demand forward and reverse it quickly. AI stocks compete for the same risk appetite. Tokenized equities give stablecoins a route around crypto, with the largest effect on altcoins.
The base case is a more institutional cycle with smaller issuance shocks, larger flow shocks, tighter links to equities, and fewer broad altcoin rallies. That will not look exactly like 2013, 2017, or 2021. It also falls short of a permanent supercycle.
Sources
Correction, September 23, 2026: added the InvisibleHill relationship beside BigRoom, linked the exchange product claims to official documents, clarified the denominator of Bitget's reported market share, and removed the unsupported 529-rToken count and peripheral $5 minimum. The market and indicator observations retain their August 2026 dates; the exchange documentation was rechecked for this correction.
This report treats the halving schedule as protocol fact, market-cycle claims as historical observations, and the supercycle conclusion as an analytical judgment. The ETF-flow, correlation, and indicator observations belong to the original August 9, 2026 analysis. Exchange product statements are tied to the official documents linked here.
- Bitcoin Developer Reference, block subsidy and 210,000-block halving schedule
- U.S. Securities and Exchange Commission, approval of spot Bitcoin exchange-traded products
- NYDIG, Cycle Narratives and What Comes Next
- Fidelity Digital Assets, Is Bitcoin's Four-Year Cycle Over?
- CME Group, Can Crypto World Break Free From Bitcoin's Undertow?
- Nasdaq, 2025 Nasdaq-100 Reconstitution and Performance Highlights
- Binance, bStocks deposit, withdrawal, and conversion FAQ
- Bitget, June 2, 2026 Stocks 2.0 launch and reported tokenized-stock volumes